At WeInfuse, we think the annual Magellan Trend Reports are our industry’s manna from heaven. This year’s report is no different, and it’s full of gold nuggets that prove the provider-based (e.g. physician, NP, and/or PA) Infusion Center is the optimal site of service providing patients quality, convenient and cost-effective care. Whether you operate a stand-alone Infusion Center or provide infusions as a part of your practice, this content is game changing.
How can you use this year’s report?
- Use it when advocating for your Infusion Center and the delivery channel at large
- Use it to negotiate with your payers for better rates since Infusion Centers are the proven optimal site of care
- Be a more informed administrator or executive by understanding the current trends and changes in this dynamic industry
Below are some important highlights from the report that pertain to our niche, the non-chemotherapeutic (autoimmune) provider-based Infusion Center:
Introduction (page 1)
“By 2022, the number of billion-dollar drugs will rise by 26% from 34 drugs in 2017 to 43 drugs in 2022. In the autoimmune category specifically, the [per-member-per-month] PMPM drug costs are expected to increase 90%…”
Medical Benefit Pharmacy Overview (page 4)
Once again, the Magellan Report confirms that the provider-based Infusion Center is the optimal site of care compared to hospital and institutional settings. In the last paragraph on page 4, the report notes:
“The commercial hospital outpatient setting not only housed the majority of medical benefit spend, but also more than doubled (100% to 109% higher) the costs of the physician office when indexed to national benchmarks such as average sales price (ASP).”
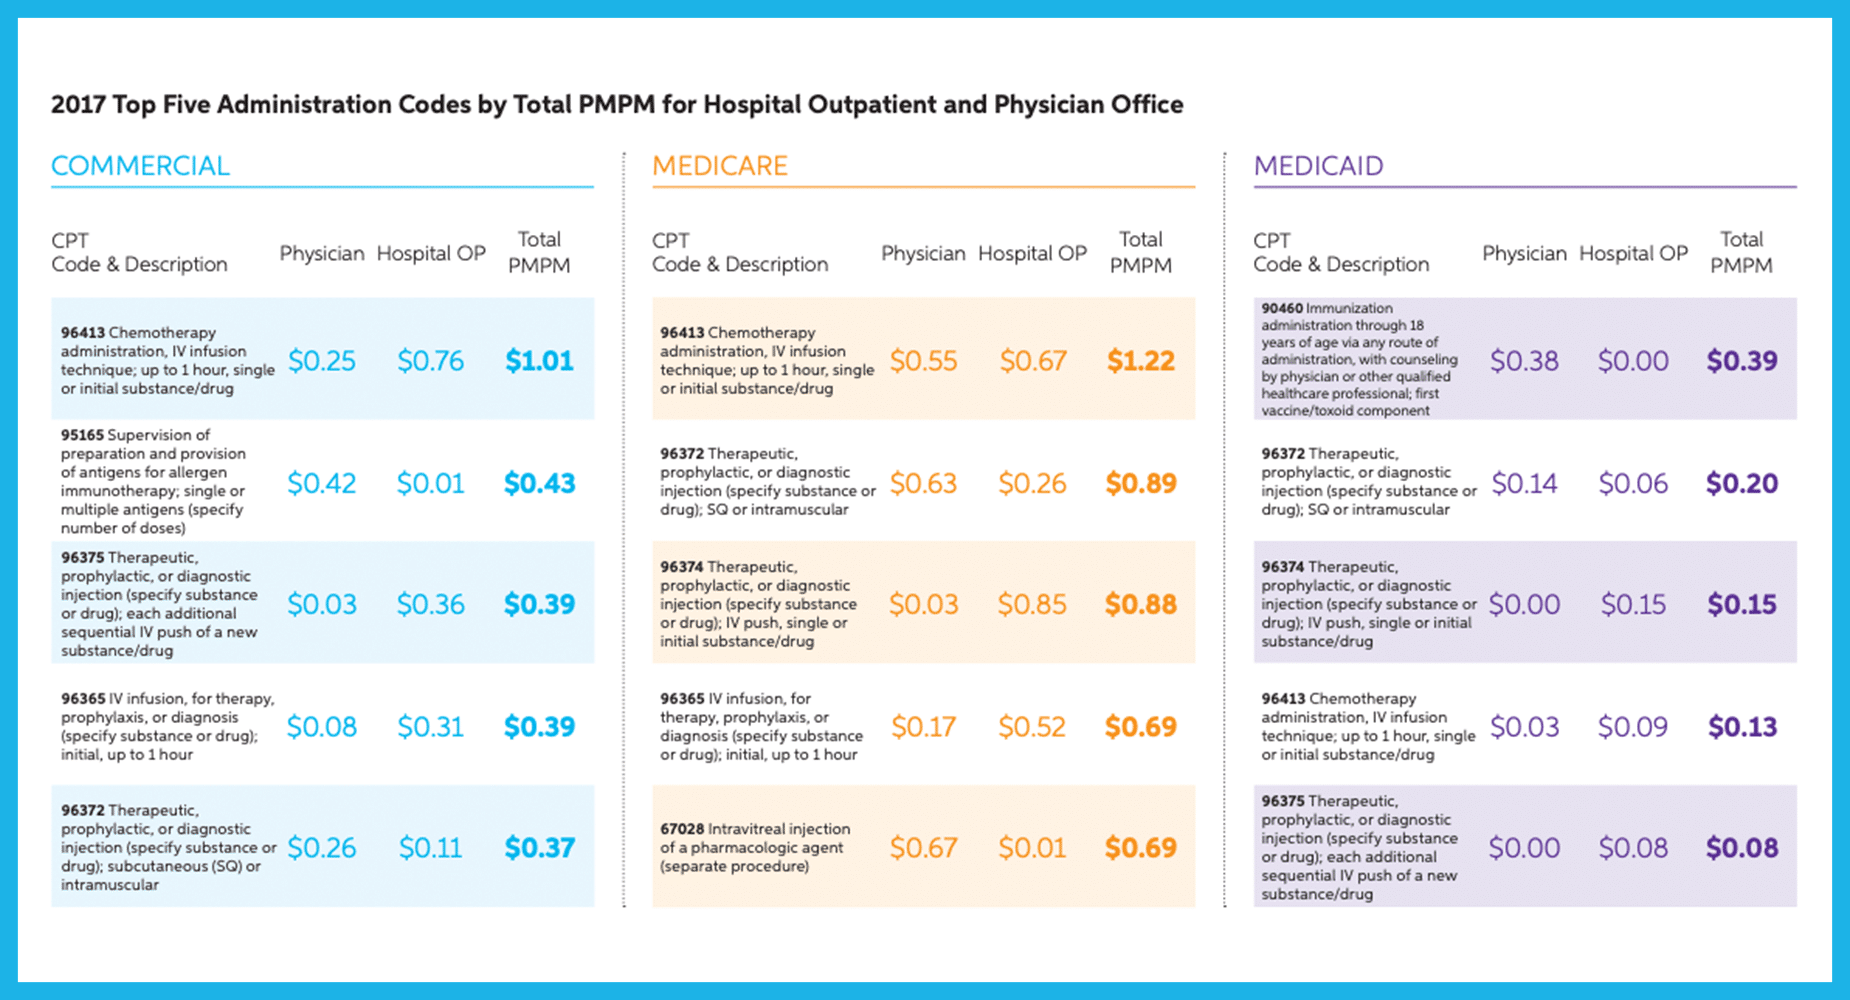
Administration Code Reimbursement (page 11)
New in the Magellan Report this year was the breakdown in infusion administration codes such as 96413 and 96365. Importantly, the Magellan report highlights that the commercial infusion administration reimbursement for the code 96413 was three times higher for hospitals than that of the physician office.
Medical Benefit Categories: Asthma COPD (page 13)
In this category, the most common provider-administered injections include: Xolair, Nucala, and Fasenra. And, Cinqair is administered as an IV infusion. The Magellan report noted:
“In 2017, newcomers Nucala and Cinqair impacted this category, especially in commercial spend, as prescribing patterns moved toward these products. Asthma/COPD was mostly administered in the physician office and was one of the few categories with consistent administration across all LOBs.”
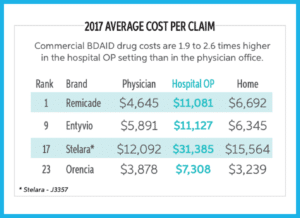
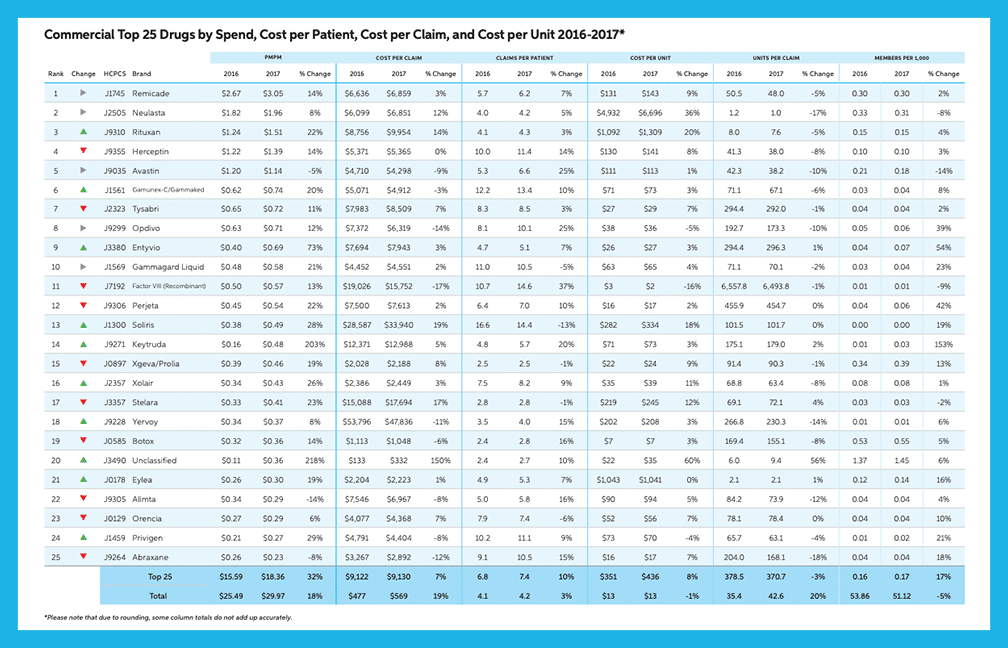
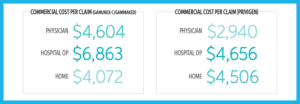
Medical Benefit Categories: Biologic Drugs for Auto-Immune Disorders (BDAIDs) (page 14)
BDAIDs are used to treat a variety of disorders including therapies for ankylosing spondylitis, Crohn’s disease / ulcerative colitis, psoriasis / psoriatic arthritis, rheumatoid arthritis, lupus, multiple sclerosis, and several others.
“BDAIDs saw double digit increases in commercial and Medicare PMPM (21% and 13%, respectively), due to higher use in the treatment of Crohn’s/UC and Rheumatoid Arthritis. Remicade continues to rank first or second in both commercial and Medicare.”
“In commercial, changes to Stelara dosing and the unmet need fulfilled by Stelara and Entyvio led to a 23% increase in PMPM…Entyvio saw a 73% increase in spend.”
“BDAIDs have the highest potential for category growth as it is forecasted to increase in spend by 90% by 2022.”
Medical Benefit Categories: Immune Globin (page 15)
“PMPM spend for IG drugs was the third highest in commercial and fourth highest in both Medicare and Medicaid. Despite this high spend, intravenous immune globin (IVIG) and subcutaneous immune globin (SCIG) remained a low volume category….commercial costs may be 50% higher in the hospital outpatient setting.”
Product Preferencing / Rebating (page 20)
“In 2018, 71% of commercial payers (91% of medical benefit lives) managed medical benefit products with some sort of product preferencing in place. More than half of commercial payers preferenced BDAIDs (56%)…”
Utilization Management Tools (page 20)
“Payers continued to lean on prior authorizations (PA) in both commercial and Medicare Advantage. One-fifth of payers, 20% in commercial and 22% in Medicare, used post-service claim edits as a secondary utilization management strategy. Payers denied PA at a rate of 24% in commercial and 20% in Medicare. Post-service claim edits had a denial rate of 15% across both LOBs.”
New (Unclassified) Specialty Drugs: Coverage and Management (page 24)
“Due to the absence of real-time claims adjudication and a traditional formulary process on the medical benefit, payers are unable to implement edits to manage utilization of new specialty drugs to market as they can on the pharmacy benefit. In absence of these tools, 93% of payers used unclassified code PA requirements with 55% implementing immediately after FDA approval and 74% within the first three months of release. More than one-quarter of payers (29%) wait for the NDC* to be available, with 100% implementing PA within three months of release. Still, 17% of payers performed a review of the new therapy prior to the decision of coverage of the unclassified code.
*We believe the authors of the report meant HCPCS code (J Code).
Almost half of payers (44%) implemented a post-service claim edit (PSCE) for unclassified drugs, with 35% implementing after FDA approval and 40% implementing after NDC availability, both within three months of release.”
Biosimilar Reimbursement (page 26)
“Close to half of payers (49%), preferenced biosimilars over the reference product and on average needed the cost savings for that biosimilar to be 28% in order to warrant preferencing the biosimilar product.
In a large swing from previous years, more than half of payers (51%) required members to step through a biosimilar before utilizing its reference product.”